We have created a look-up pressure dew point chart that you can download and keep as a handy reference.
The pressure dew point chart tables include conversions using the Sontag and Wexler methods. Alternatively, you can use our dew point calculator for different parameter conversions.
How to use the pressure dew point conversion chart
The top row of each chart shows the dew point at normal atmospheric pressure (ATM), you can read the chart both ways by looking up your measurement point and finding the nearest Dp to allow conversion to another pressure.
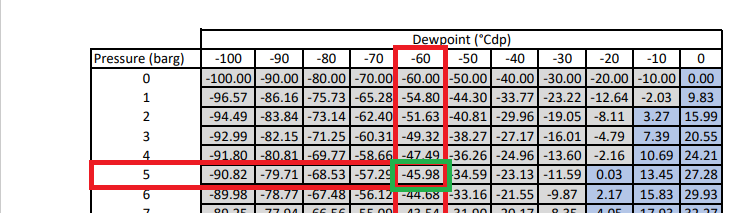
Calculating dew point at -60oC measuring point as pressure increases to 5 barg using a pressure dew point chart.
For Example, as seen in the pressure/dew point conversion chart above using -60oC measurement point at 5 barg atmospheric pressure, we are able to determine -45oC as the dew point.
Download our pressure dew point conversion chart over ice and water
Sontag’s Pressure Dew-Point Chart in PDF
Pressure Dewpoint chart (sontag)
|
|
Dewpoint (°Cdp) |
||||||||||
|
Pressure (barg) |
-100 |
-90 |
-80 |
-70 |
-60 |
-50 |
-40 |
-30 |
-20 |
-10 |
0 |
|
0 1 2 3 4 5 6 7 8 9 10 11 12 13 14 15 16 17 18 19 20 |
-100.00 |
-90.00 |
-80.00 |
-70.00 |
-60.00 |
-50.00 |
-40.00 |
-30.00 |
-20.00 |
-10.00 |
0.00 |
|
-96.57 |
-86.16 |
-75.73 |
-65.28 |
-54.80 |
-44.30 |
-33.77 |
-23.22 |
-12.64 |
-2.03 |
9.83 |
|
|
-94.49 |
-83.84 |
-73.14 |
-62.40 |
-51.63 |
-40.81 |
-29.96 |
-19.05 |
-8.11 |
3.27 |
15.99 |
|
|
-92.99 |
-82.15 |
-71.25 |
-60.31 |
-49.32 |
-38.27 |
-27.17 |
-16.01 |
-4.79 |
7.39 |
20.55 |
|
|
-91.80 |
-80.81 |
-69.77 |
-58.66 |
-47.49 |
-36.26 |
-24.96 |
-13.60 |
-2.16 |
10.69 |
24.21 |
|
|
-90.82 |
-79.71 |
-68.53 |
-57.29 |
-45.98 |
-34.59 |
-23.13 |
-11.59 |
0.03 |
13.45 |
27.28 |
|
|
-89.98 |
-78.77 |
-67.48 |
-56.12 |
-44.68 |
-33.16 |
-21.55 |
-9.87 |
2.17 |
15.83 |
29.93 |
|
|
-89.25 |
-77.94 |
-66.56 |
-55.09 |
-43.54 |
-31.90 |
-20.17 |
-8.35 |
4.05 |
17.93 |
32.27 |
|
|
-88.60 |
-77.21 |
-65.74 |
-54.18 |
-42.53 |
-30.78 |
-18.95 |
-7.01 |
5.74 |
19.81 |
34.37 |
|
|
-88.01 |
-76.55 |
-65.00 |
-53.35 |
-41.61 |
-29.78 |
-17.84 |
-5.79 |
7.26 |
21.52 |
36.28 |
|
|
-87.48 |
-75.95 |
-64.33 |
-52.60 |
-40.78 |
-28.86 |
-16.82 |
-4.68 |
8.66 |
23.08 |
38.03 |
|
|
-86.99 |
-75.40 |
-63.71 |
-51.91 |
-40.02 |
-28.01 |
-15.89 |
-3.65 |
9.95 |
24.53 |
39.64 |
|
|
-86.53 |
-74.89 |
-63.13 |
-51.28 |
-39.31 |
-27.23 |
-15.03 |
-2.70 |
11.15 |
25.87 |
41.15 |
|
|
-86.11 |
-74.41 |
-62.60 |
-50.68 |
-38.65 |
-26.50 |
-14.22 |
-1.82 |
12.27 |
27.12 |
42.55 |
|
|
-85.72 |
-73.97 |
-62.10 |
-50.13 |
-38.03 |
-25.81 |
-13.47 |
-0.99 |
13.32 |
28.30 |
43.88 |
|
|
-85.35 |
-73.55 |
-61.63 |
-49.60 |
-37.45 |
-25.17 |
-12.76 |
-0.21 |
14.31 |
29.42 |
45.13 |
|
|
-85.00 |
-73.15 |
-61.19 |
-49.11 |
-36.90 |
-24.56 |
-12.09 |
0.59 |
15.25 |
30.47 |
46.31 |
|
|
-84.67 |
-72.78 |
-60.77 |
-48.64 |
-36.38 |
-23.99 |
-11.46 |
1.39 |
16.14 |
31.48 |
47.44 |
|
|
-84.35 |
-72.43 |
-60.38 |
-48.20 |
-35.89 |
-23.44 |
-10.85 |
2.14 |
16.99 |
32.43 |
48.51 |
|
|
-84.06 |
-72.09 |
-60.00 |
-47.78 |
-35.42 |
-22.92 |
-10.28 |
2.86 |
17.80 |
33.34 |
49.54 |
|
|
-83.77 |
-71.77 |
-59.64 |
-47.37 |
-34.97 |
-22.42 |
-9.73 |
3.55 |
18.58 |
34.22 |
50.52 |
|
OVER WATER
OVER ICE
Dewpoint (°Cdp) at Δpressures (Sontag)
Sonntag’s pressure dew point conversion chart over ice and water
Download Sonntag’s Pressure dew point chart pdf
Wexler’s Pressure Dew-Point Chart in PDF

Hyland Wexler (1983) and Sonntag (1994) Water vapor pressure formulas
The Hyland Wexler (1983) and Sonntag (1994) water vapor pressure formulas are very similar and the overall differences in resulting pressure dewpoint are small. However, the Sonntag formula is the same as an older formula by Wexler (from 1976) but with coefficients updated to the ITS-90 temperature scale.
Hyland-Wexler (1983) and Sonntag (1994) formulas are two empirical equations used to calculate the saturation vapor pressure of water in air. Both formulas are based on data collected from laboratory experiments and are widely used in meteorology, engineering, and other related fields.
One similarity between the two formulas is that both use the temperature as the main input variable. This means that the saturation vapor pressure of water in air is a function of temperature, as stated by the Clausius-Clapeyron equation. Both formulas use a polynomial expression to calculate the saturation vapor pressure as a function of temperature.
A difference between the two formulas is the range of temperatures for which they are applicable. The Hyland-Wexler formula is only valid for temperatures ranging from -100°C to 0°C, while the Sonntag formula is valid for temperatures ranging from -80°C to +50°C. This means that the Sonntag formula is more versatile and can be used in a wider range of applications.
Another difference is the accuracy of the two formulas. The Sonntag formula is considered to be more accurate than the Hyland-Wexler formula, especially at high temperatures. However, the Hyland-Wexler formula is still widely used because it is simple to implement and requires less computational resources.
In conclusion, both the Hyland-Wexler and Sonntag formulas are useful for calculating the saturation vapor pressure of water in air. The choice of which formula to use will depend on the range of temperatures involved and the accuracy required for a particular application.
Michell uses the Sonntag formula in their products while Rotronic uses the Hyland Wexler formula in its products.
Calculate Pressure Dew Point with Our Humidity Calculators
Calculating PDP doesn’t have to be overly complicated using the traditional dew point charts, our humidity calculators let you calculate dew point, frost point, vapor concentration, water vapor content, relative humidity, and enthalpy in just a few clicks.
Here is a video on how to calculate pressure dew point using our Humidity Calculators in place of a dew point chart table
Watch the short video above on how to use our dew point and humidity calculators citing examples of calculating dew point at different pressures, at atmospheric pressure, and calculating maximum absolute humidity before saturation using ppmV / %vol.
Calculating Pressure Dew-Point (FAQs)
What are the factors influencing dew point calculations?
Pressure dew point (PDP) is the temperature at which water condenses in a pressurised gas – for example in a compressed air system. If the pressure of the gas increases, the dew-point temperature also increases.
The temperature at which the water vapor in gas then condenses is dependent on the absolute moisture content and pressure of the gas.
The graph below shows how increasing pressure affects the dewpoint at -60oC. This is based on Sonntag’s formula.

How does calculating pressure dew point (PDP) help avoid condensation?

In applications where water dew points is measured in order to avoid condensation such as natural gas pipelines and compressed air systems, changes in pressure can influence the dew point calculation of such systems.
It is therefore important that you know the pressure at the sampling point where the dew-point is measured.
Learn more about pressure dew points (PDP) and how to calculate them.
Pressure dew point chart can not be used for moisture in natural gas calculation as these are based on real empirical data from IGT bulletin #8 and ISO 18453 and not the ideal gas law.
We have a dedicated calculator to help you measure moisture in natural gas.
What industrial instruments are used to measure dew point and moisture content?

Instruments used to measure dew point and moisture contents are different in several applications, PST offers a range of Portable Dew Point Meters, Dew-Point Tranmitters, Hygrometers, Humidity and Temperature Calibration Systems, Process Moisture Analyzers, and Hydrocarbon Dew Point Analyzers.
Contact Us for advice on your application.
Related Articles
Dew Point Definition and How to Measure It for Industries?
Author: Tobi Akinrinmade (Digital Marketing Executive)
Related Products
Compressed Gas Dew Point Meter - Easidew PDP
Dryer Portable
Portable Dew-Point Hygrometer - Michell MDM300 Series

Want to see more information like this?
Sign up to one of our Industry newsletters and you’ll receive our most-recent related news and insights all directly to your inbox!
Sign Up